
Utilize Visualization Prompts in an Agent
Beginning in Strategy One (September 2025), enhanced bots are available out of the box and have been renamed to agents to reflect the improvements and advancements.
-
For details on the 2.0 enhancements, see Agent Enhancements.
Beginning in Strategy One (June 2025), agents can display customized visualizations, rather than questions, that serve as prompts for your analysis. You can quickly view the important information in these prompts, or click the visualization to explore more details.
-
In Library, click an agent to open it. You can use the Filters panel to search for a specific agent name or filter to display only agents, as shown below:

Your agent opens and displays a customized greeting. Depending on its layout, it may also display suggestions only (if no prompts have been defined), visualization prompts, or suggestions with a Common Questions button.
-
If your agent displays prompts, Interact with Prompts.
-
To access all visualization prompts, even if they do not display on the home page, click Common Questions. Click a prompt to generate the response, then Interact with Prompts.

-
Once you ask a question, the Common Questions button no longer displays. To access all visualization prompts, click the Prompts icon
 above the question box. The prompt names display in the Common Questions window.
 -
If your agent displays suggestions only, or if you want to ask a specific question, see Ask Questions in an Agent.
-
-
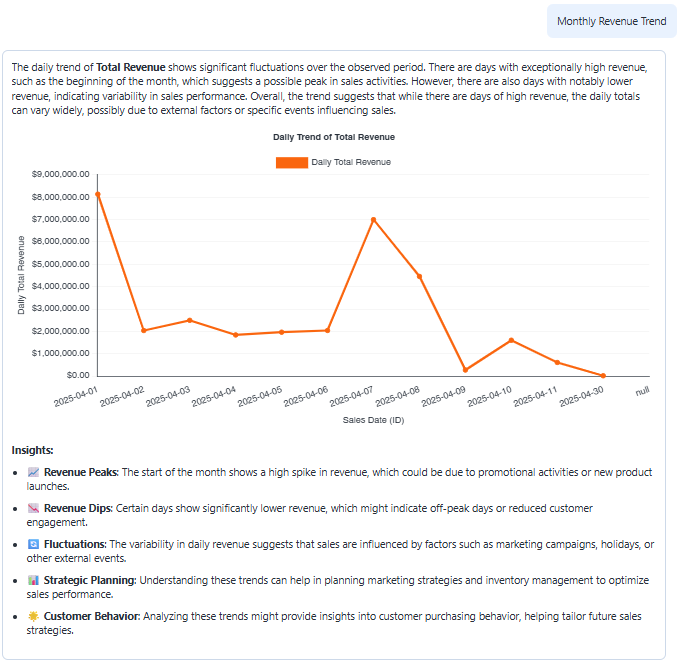
Hover over a visualization to see details. For example, in the Monthly Revenue line graph shown below, you can view the exact revenue value for each date.

- To explore more details and start a conversation about one of the visualization prompts, click the visualization. In the example below, the user clicked a Monthly Revenue Trend graph. The original graph displays larger and with more detail, including a robust description with trend information at the top. A bulleted list of insights displays below the graph.
-
Starting in Strategy (August 2026), a list of attribute elements (such as cities or product categories) may display, if the prompt is dynamically filtered. If this occurs, select the elements to include in the prompt. Click Submit
 or press Enter.
In the example below, the prompt is "What is the revenue @City" and a list of cities displays.

-
View AI Interpretation for insights on how the agent interpreted and executed the prompt.
-
If snapshots have been enabled, the My Snapshots icon
 displays at the top right of the agent. Snapshots are saved agent responses that you can review later.
- To save an answer as a snapshot, hover the response and click the Take a Snapshot icon . The message is added to the My Snapshots panel and the Take a Snapshot icon for the response turns blue (or the color is defined in the panel theme). The snapshot contains both the question and answer.
- To display the My Snapshots panel, click the My Snapshots icon in the top right.
- For steps to work with snapshots, such as exporting, sorting, searching, and deleting them, see My Snapshots Panel.
- To save an answer as a snapshot, hover the response and click the Take a Snapshot icon
-
To copy an answer:
- Hover over the bottom of the answer.
- Click the Copy as Image icon
 .
. - You can then paste it into an email, chat, or other application.
-
To export the answer to a comma-separated value (CSV) file for further analysis:
- Hover over the bottom of the answer.
- Click Export to CSV
 .
.
Beginning in Strategy One (August 2025), the export limit is increased to 100,000 rows so you export larger datasets. Data with different locales is correctly displayed in the exported file; however, certain formatting details, such as color, may be lost.
-
If the answer is more complex than a single answer, you can:
-
Export the answer to Excel for further analysis:
-
Hover over the bottom of the answer.
-
Click the Export to Excel icon
 .
. Beginning in Strategy One (August 2025), the export limit is increased to 100,000 rows and Excel reports retain column formatting. This means you can export larger datasets while preserving the original format, including data with different locales. Certain complex custom formatting may not be supported in Excel; the exported Excel file displays it as raw, unformatted data.
-
-
Download the answer as an image file:
-
Hover over the bottom of the answer.
-
Click the Download icon
 .
.
-
-
-
To see suggestions related to the visualization, click Suggestions
 above the question box.
-
To view a different prompt, click the Prompts icon
above the question box. The prompt names display in the Common Questions window. -
To run a prompt, click its name. The answer displays in the main page, closing the Common Questions window.
-
To copy the prompt description and refine it, click the Copy icon
 next to it. The description displays in the question box of the main page, closing the Common Questions window.

-