Strategy One
Link from a Dashboard to a Prompted Dashboard
You can use prompted reports to allow users to provide input to filter and retrieve data on a dashboard. Using a prompted dashboard as the source, you can link to a different prompted dashboard to pass prompt answers selected on the source to the target.
If the source dashboard does not contain prompts, you can define how each of the target's prompts are answered:
- Answers the user supplies to the prompt
- The objects selected in the source visualization
- The prompt's default answer
- No answers
- The objects selected in a specified visualization filter on the source, starting in Strategy One (April 2026)
Most of these methods do not require manually answering the prompt. Because prompts are contained in a dashboard's dataset, this affects the entire dashboard. Only the data allowed by the prompt answers is available to the dashboard.
You can combine answering the target's prompts with filtering the page, just as with any other contextual link.
Starting in Strategy One (February 2026), you can link specific attributes and metrics to the target dashboard. For more details and steps, see Use a Visualization to Filter Data in a Different Dashboard.
Starting in Strategy One (August 2025), you can filter additional pages in the target dashboard, not just the one initially opened in the link. The target page displays when you use the link, but the selected pages are also filtered. This helps pass the filter context to other pages.
Prerequisites
- Check the prompts in both the source and target dashboards. You want to be sure that you understand how the dashboards can be linked. If you want to answer the target's prompts with the source's prompt answers, the target and source must contain the same prompt.
Review KB484398: Limitations for using contextual linking in dashboards for detailed information.
Create a Contextual Link on a Visualization to Answer Prompts in a Different Dashboard
- Open the dashboard to use as the source.
- Hover over the visualization to use as the source and in the top right, click More
 and choose Create Contextual Link.
- If the option displays as Edit Contextual Link, the visualization already contains a contextual link. Click it to continue.
- If the visualization already targets visualizations in the same dashboard, a message displays. The visualization cannot be a source for both target visualizations and contextual links. To remove the target visualizations, click Continue. To keep the target visualizations instead of creating a contextual link, click Cancel.
-
In the Enable Link For drop-down list, ensure that Visualization is selected; this is the default.
-
Starting in Strategy One (February 2026), you can link specific attributes and metrics. For steps, see Use a Visualization to Filter Data in a Different Dashboard.
-
-
In the Contextual Link dialog box, click the folder icon
 .
. -
Choose the dashboard to link to and click OK.
-
From the Page drop-down list, choose a page of the dashboard to target. All visualizations in the target page are filtered according to the Filter options you define below.
- In Tooltip, enter a description for your tooltip. The tooltip displays when you hover over the source visualization and links to the target page.
- If you do not want to display the link in the tooltip, do not type anything into the Tooltip box. Users access the link by right-clicking an object in the source visualization. The default text for the link includes the target dashboard. For example, it displays as Go to Dashboard: Target Name.
-
Select whether to Open in new tab. The target opens in a new window Strategy Web and Library.
These Filter options are not mutually exclusive. You can select and clear any combination of them, including clearing all the check boxes, which means that nothing is passed to the target.
- To pass the filter panel conditions to the target page, select Pass the filter panel selections to the chapter of the target page.
-
To pass the visualization (in-canvas) filter conditions to the target page, select Pass selections in all visualization filters to the target page.
The attributes and metrics used in the Filter panel for both the source and target dashboards must be the same or match by filter name. See KB483883: Limitations of using a visualization to filter data in a different dashboard for more information.
- To pass the selected data in the source visualizations to filter the target page, select Use selections to filter target page's visualizations. This option is available starting in MicroStrategy ONE Update 11.
- The target dashboard opens on the page selected in the Page drop-down list. That page is filtered according to the Filter options you selected above. Starting in Strategy One (August 2025), you can filter additional pages in the target dashboard, not just the one initially selected. From the Pass selected filters to following pages of target dashboard drop-down list, select the check boxes for any additional pages to filter.
- You can select a chapter to filter all its pages. Any pages added to this chapter in the target dashboard after you create the link will be filtered.
- To filter all the pages in the dashboard, select All. Any pages added to the target dashboard after you create the link will be filtered.
- If all of the Filter options are cleared, this list is unavailable, since no filter conditions are passed.
-
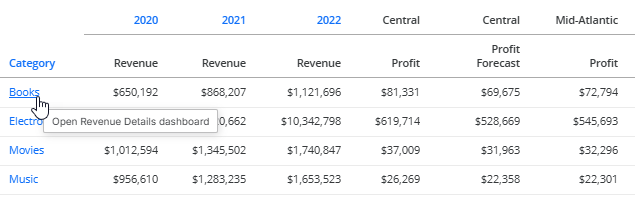
Starting in Strategy One (April 2026), if the source visualization is a modern grid, you can format the hyperlink. In the Format area, select the Apply Hyperlink Style check box. Linked objects are visually distinguishable because they display in blue and underlined. By default, the check box is cleared, so the grid formatting is not changed; you cannot detect a link from the visual grid display.
In the sample below, the hyperlink style is applied. The categories and years, which are linked to the Revenue Details dashboard, display as hyperlinks. The regions are not linked and display in black.
Define How to Answer Each Prompt
Complete the following steps for each prompt in the target dashboard.
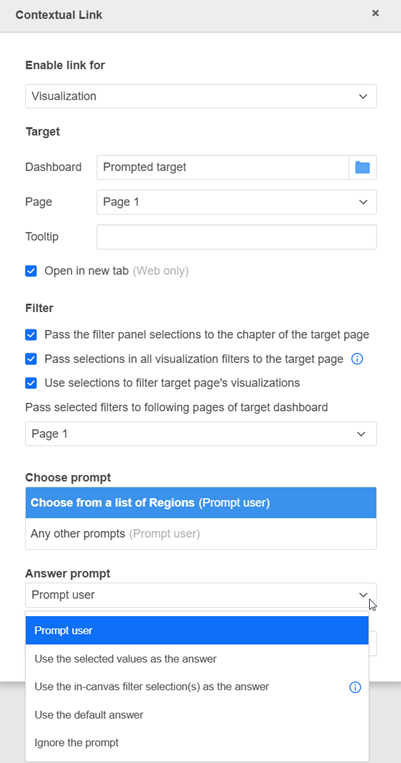
- By default, the first prompt from your prompted dashboard is selected in the Choose a prompt list. Select the prompt to answer.
- Select Any other prompts to configure a default Answer prompt for any additional prompts added to the target dashboard in the future.
- From the Answer prompt drop-down list, choose how your selected prompt is answered. With all methods except Use the selected objects as the answer, the selections are ignored for the prompts, but they are used to filter the target, depending on the Filter options you defined above.
- Prompt user: The user is prompted to provide an answer to the selected prompt after the link is clicked.
- Use the selected values as the answer: The selected prompt is answered with the objects selected in the source visualization. Use this when the objects in the visualization match the objects in the prompt. If they do not match, this prompt answer method is not available.
- Use the visualization filter selection(s) as the answer: Starting in Strategy One (April 2026), the selected prompt is answered with the objects selected in a visualization filter on the source. This option is available only if the source page contains at least one visualization filter which can be passed.
- If you select this method, choose the source filter from the drop-down list.
- If the filter is not available in the view, its selection is not passed to the target and the user must answer the prompt.
For example, Panel 1 of a panel stack contains a Region filter targeting a grid not on the panel stack. The contextual link on the grid is defined to pass the Region selection to the target dashboard. When a user uses the contextual link, the selected regions answer the target's prompt. If the user switches to Panel 2 of the panel stack, then uses the contextual link. Because the Region filter is not available in the view, the filter selections are not passed. The target's region prompt displays for the user to answer.
- Use the same answer from the source prompt: The selected prompt is answered with the objects selected in the source dashboard's prompt. This prompt answer method is available when the source and target contain the same prompt.
- Use the default answer: The selected prompt is answered with the prompt's default answer.
- Ignore the prompt: The source does not provide a prompt answer and the user is not prompted to provide answers. If the selected prompt is required, the user is prompted to provide an answer after the link is clicked.
Prior to MicroStrategy Update ONE Update 11, this option was named Use the selected objects as the answer.
Save the link
- Click Save.
- Save the dashboard.
Test the Link
- In the source dashboard, hover over a data point in the visualization and click the tooltip.
- Test the Link
- Hover over the object in the visualization. You know that the visualization is linked because the link icon displays in the upper left corner.
- If the cursor turns into a hand pointer, click the object to open the target dashboard page.
- If a tooltip displays with the link, click the object and then click the link.
- If it does not, right-click the object and then click the link.
Depending on the Answer Prompt option you defined, you may need to answer the target's prompts, if they are not answered automatically. The target page displays filtered according to the filter selections you defined.
-
To remove the visualization filter from a visualization in the target dashboard, hover over the visualization in the target dashboard and in the top left corner, click Clear Filter
 . The prompt answers are not affected by removing the filter.
Remove a Contextual Link
- Open the dashboard you want to modify.
- Hover over the visualization used as the source, click More in the top right corner and choose Edit Contextual Link.
- Click Remove Link. The link is removed and you are returned to the dashboard.