
Create a Modern Grid in Table View
Beginning in Strategy (September 2026), you can place attributes and metrics next to each other in a modern grid's columns. Think of it as displaying attributes, metrics, more attributes, and then more metrics, rather than the standard grid of all attributes followed by all metrics. Use the flexibility of this table view to display descriptive information (attribute elements) between the metric values, as opposed to always on the left side of the grid. This flexibility is especially important in financial style reporting.
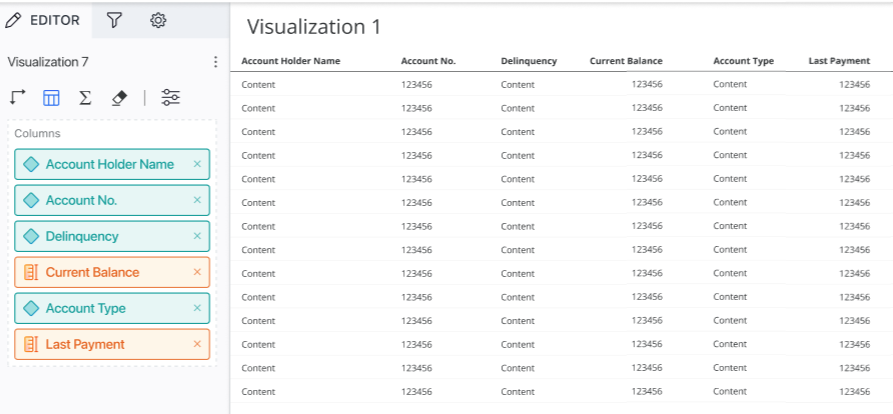
Table View is not available if the modern grid contains column or sets. If the modern grid contains a microchart, the attribute and metric in the microchart display as separate columns.
Create a Modern Grid in Table View
-
In the top toolbar, click

- Choose Grid then Grid (Modern)
 .
. - Add the first object to the grid (an attribute or a metric).
- In the toolbar of visualization's Editor panel, click the Table View icon
 .
. -
In Table View, the Editor panel displays the Columns drop zone only. Add objects to the grid in the order to display them in.
-
You can total the rows and columns of the modern grid.
-
Define Custom Subtotals in Modern Grids(beginning in Strategy One (December 2025))
-
Starting in Strategy One (March 2025), you can format a modern grid at a more granular level. You can individually format each attribute and each metric column, as well as format all attributes, all metrics, or all microcharts at once. For more information on this individual formatting, see Format Panel for Grid Visualizations. For general information on formatting grids, including modern grids, see Format a Grid.
Note: If you add a column to a grid to adjust aggregation, joins, thresholds, or sorting, you may not want end users to view the actual values or elements. In a modern grid, you can hide a column from display. The metric or attribute still displays in the Editor panel, but not on the grid when editing or viewing the dashboard. To hide the column, right-click the column header and select Hide Column. To redisplay it, click the menu icon for the grid and select Show Hidden Columns.
-
An end user viewing the dashboard does not know that any columns are hidden. However, an end user can hide and show columns as well, but it applies only to that user's view of the dashboard. For steps, see Hide Columns in a Modern Grid.