
Performance Optimization
Strategy (September 2026) introduces the Performance Optimization module provides Sentinel users with detailed, real-time visibility into query executions across the Strategy ecosystem wherever Mosaic functionality is used. Sentinel records all Universal Semantic Layer (USL) queries and Native Strategy dashboard executions running against Mosaic models, helping teams troubleshoot slow-running queries, identify performance bottlenecks, and monitor system usage across various client tools.
Key Capabilities
-
USL and Native Execution Tracking: Captures all USL queries (SQL/DAX) generated by third-party tools against any model type and native Strategy engine executions (for example, Strategy Dashboard) specifically when querying Mosaic models.
-
Comprehensive Client and Model Support: Tracks execution stats across all supported USL clients (including Tableau, Power BI, Strategy Connector, Strategy AI Agent, and MCP scenarios) against a wide variety of models (for example, In-memory/Live Intelligence cubes, In-memory MTDI, Mosaic models, including Linked models).
-
Granular Query Metrics: Logs precise SQL or DAX, execution start time (UTC), query status, total duration, output row count, target models, and underlying data sources. Users can sort and filter these logs to quickly pinpoint specific executions.
-
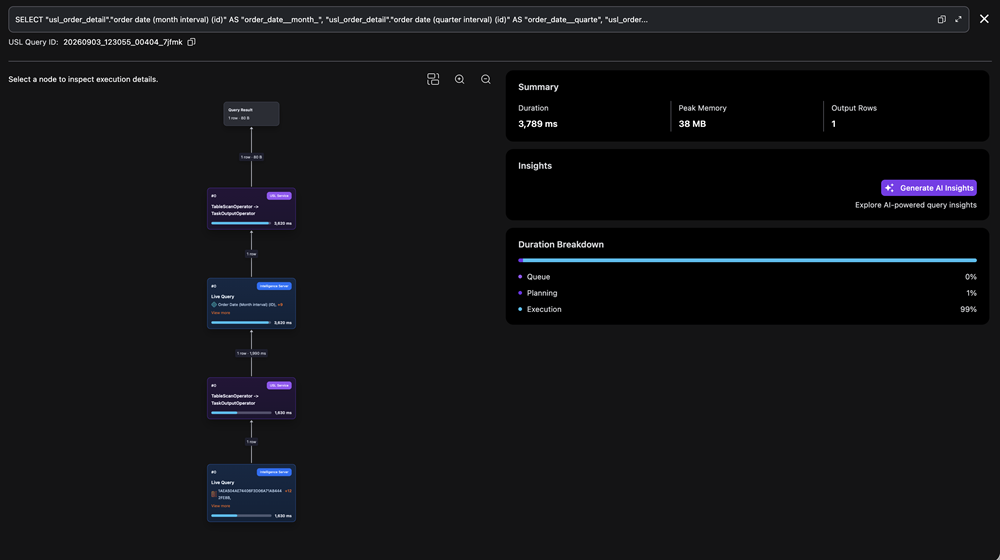
Query Profile and Execution Stages: Users can drill down into individual executions using the Query Profile. This view breaks down the end-to-end execution time into specific stage durations (for example, Intelligence Server, USL) and displays the exact query fragments to help isolate performance bottlenecks.
-
30-Day Data Retention: Due to the heavy volume of logging generated by query executions, Sentinel retains detailed performance logs for exactly 30 days. Older logs are automatically deleted to manage storage efficiently.
View Query Profiles
To view granular information on a query:
-
In the Library sidebar, click Mosaic Sentinel.
-
Click Performance Optimization.
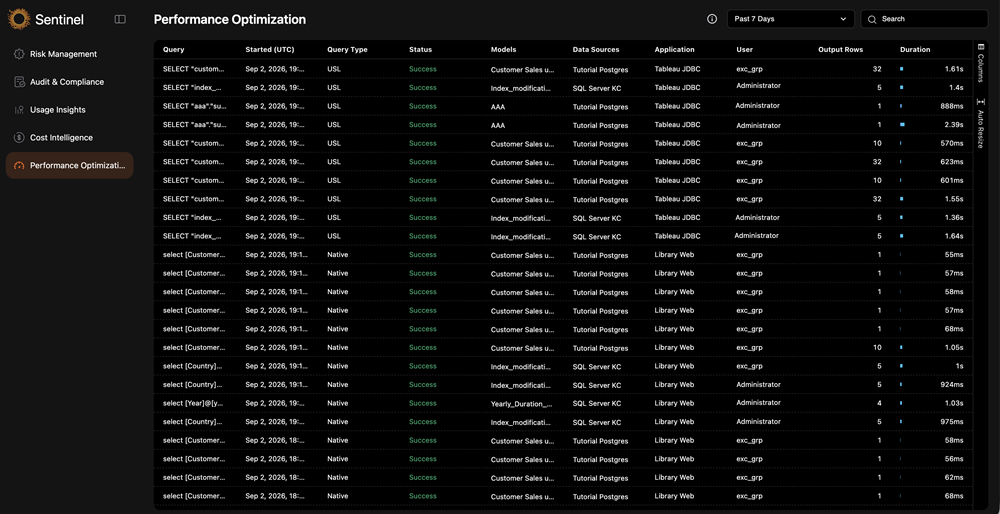
Use this page to view end to end performance duration for Universal Semantic Layer execution and native queries (Strategy internal queries (for example, Strategy visualizations)).
-
Click a Query in the grid to view a detailed breakdown of what time is spent on, which high level components are included, and which stages.
-
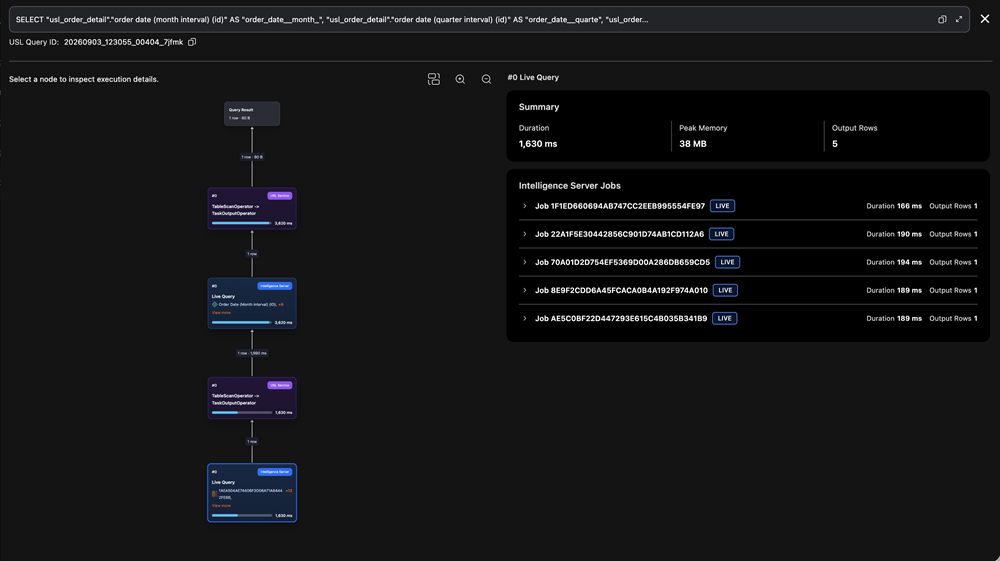
Click a component in the execution path in the left dialog to examine more granular job statistics.
-
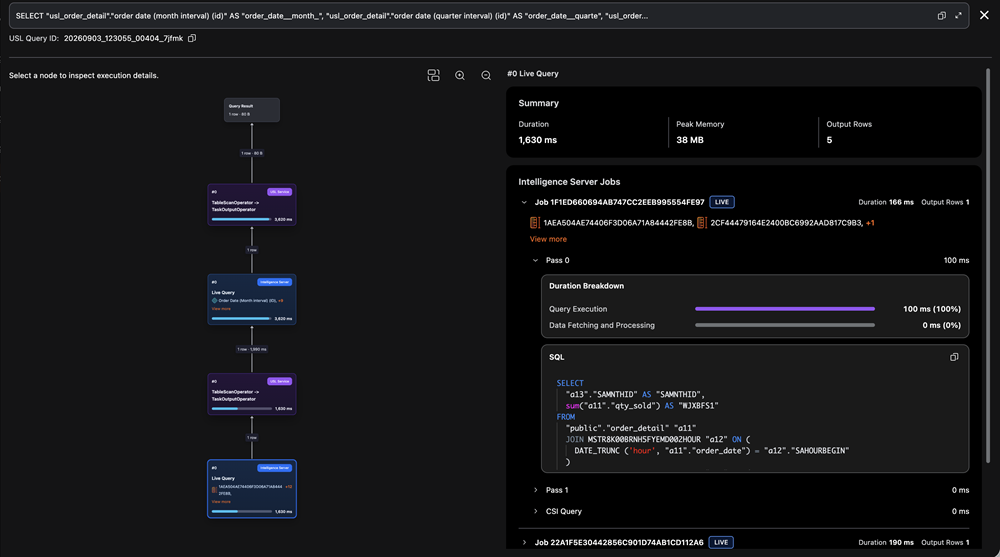
Expand a job under Intelligence Server Jobs to view the SQL statements that were run per Intelligence Server job.
-
To view an AI-generated summary on how time is spent, click Generate AI Insights under Insights.
-
Close the Query Profile.