Strategy ONE
Viewing data at different levels: drilling
Drilling lets you view your data at levels other than those displayed in the report or document. For example, a report displays data at the year level by default. You can drill down to view the same data at the quarter level. Alternatively, you can drill to another dimension, such as Geography, to view data at the city level.
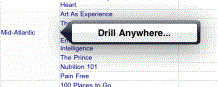
If drilling is enabled, Drill Anywhere appears when you tap and hold an attribute header or attribute element, as shown below:
To drill on a grid or graph
-
Tap and hold an attribute header or attribute element, and then release. The context menu appears.
-
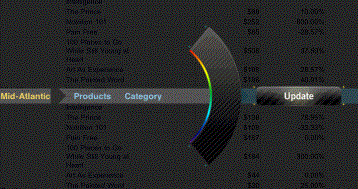
Tap Drill Anywhere (on a grid) or Drill (on a graph). The graphical drill path selector appears, as shown below. A list of dimensions to which you can drill is displayed.
-
In the drill path interface, scroll through the displayed dimensions until the one you want to drill to is highlighted in the center.
-
Tap the dimension's name. The dimension gets added to the drill path on the left, and a list of attributes representing that dimension appears.
-
Repeat the procedure, adding an attribute to the drill path. The Update icon appears, as shown below.
-
Once you have made your selection, tap Update to refresh the report with data for your chosen attribute.
-
To return to the original report, tap the Back button on the top-left.
![]()
To cancel drilling at any time, tap the close button  at the top-right of the drill path selector.
If you want to change your selections, tap the name of the first dimension you selected, shown in blue at the far left of the screen. The drill path is reset.