
Mission Control
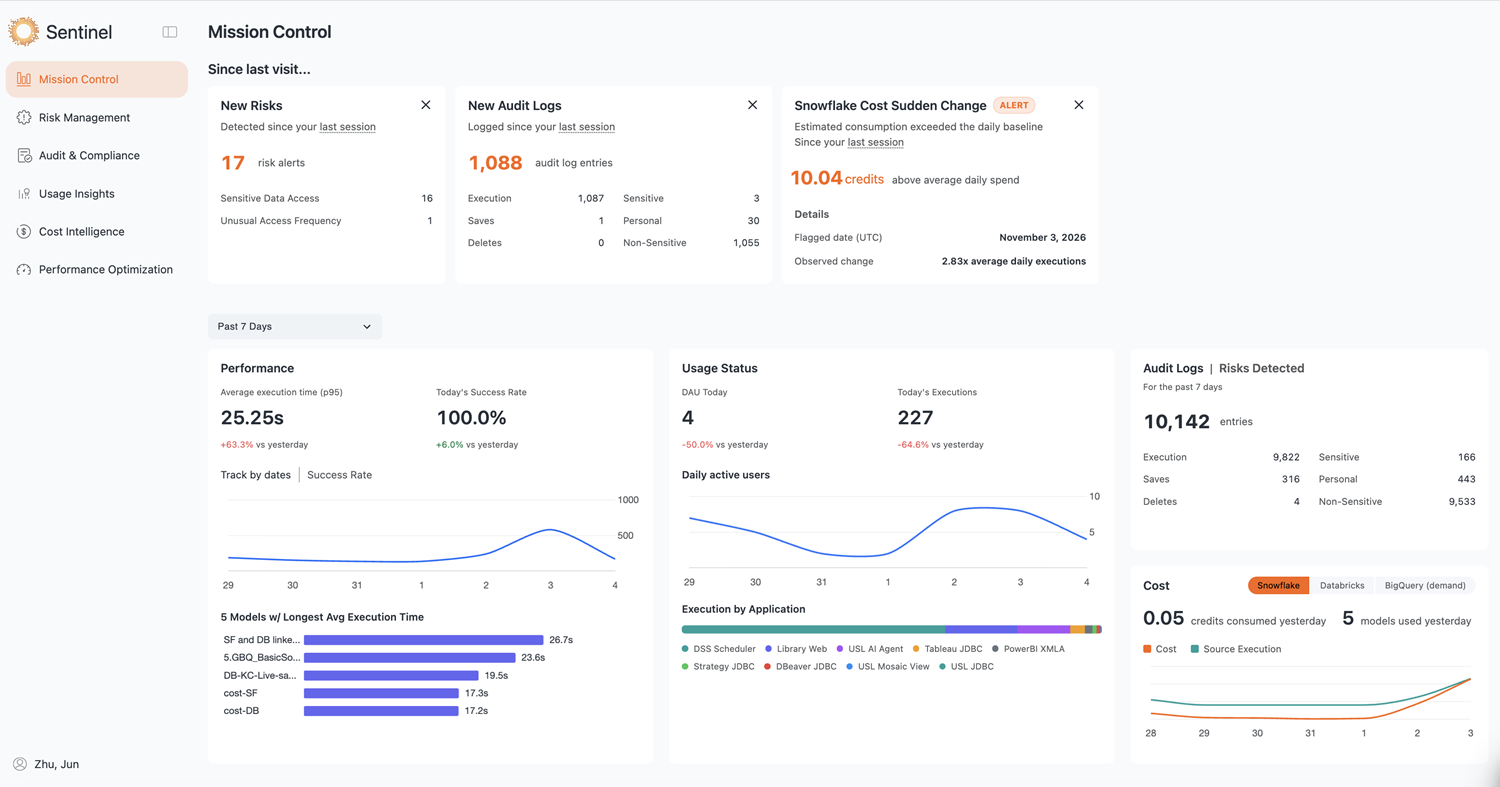
Starting in Strategy (November 2026), use the Mission Control page, a summary dashboard within that provides users with a centralized, at-a-glance view of key platform metrics and activity. Designed to surface critical information quickly, Mission Control consolidates data across multiple functional areas into a series of visualizations and summary panels, eliminating the need to navigate between your Mosaic Sentinel pages to assess overall system health.
Privileges
You must have the Use Mosaic Sentinel and Monitor Activity privileges to access Mosaic Sentinel.
View Mission Control
Access Mission Control and view the following information:
-
In the Library sidebar, click Mosaic Sentinel.
-
Click Mission Control.
-
Expand the drop-down list next to Overview and choose a data time frame.
The default value is 7 days.
-
View the following information, depending on your environment:
-
Since last visit: Displays metrics that have updated since you last viewed Mission Control.
-
Performance: Visualizes average execution time and success rate trends over the selected time period.
-
Usage Status: Tracks Daily Active Users (DAU) and execution counts over time.
-
Audit Logs: Summarizes total log entries broken down by category, including Execution, Saves, Deletes, Sensitive, and more.
-
Cost: Displays credit consumption and the number of models utilized over time, with support for filtering by data source platform such as Snowflake, Databricks, BigQuery.
-