
Preview Feature: Add Data From Multiple Projects to a Dashboard
Starting in Strategy (November 2026) as a preview feature, you can build dashboards based on data from multiple projects. Create multiple dataset reports within the same dashboard, including dataset reports sourced from different projects.
-
Creating dataset reports in a dashboard allows you to use objects in a combination not already available in an existing report or dataset.
For example, you need to build a dashboard that combines data from two separate projects: the HR project and the Sales project. The HR project contains employee information and compensation data such as salary and bonus potential. The Sales project contains performance data such as actual sales, sales quota, and quota attainment). Leadership wants a single dashboard where they can view salary and bonus potential alongside actual sales and sales quota, and compare bonus potential with quota attainment. To achieve this, inside the dashboard, create a dataset report with objects from the HR project and another from the Sales project. Link the datasets using a common attribute such as Employee ID so each employee’s HR and Sales data can display in one combined view.
While creating the dataset report, you can build a filter to retrieve only the data that you need. The filter can include any object in your project; you do not need to include the object on the dataset report.
Preview features are early versions of features and are not to be used in a production environment as the core behavior remain subject to change between preview and GA. By selecting to expose preview features in Strategy, you can access these features and use them as you would any other dashboard functionality. The official versions of preview features are included in subsequent releases.
Enable the Preview Feature
Complete one of the following procedures to enable the preview.
Enable the Preview Feature using Workstation
-
Access Workstation.
-
In the Navigation pane, click Environment Settings.
-
Select Library on the left.
-
Click More Settings in the right bottom corner of the window.
-
Click Add Property.
-
In the Key box, type features.enableCrossProjectDataset.
-
In the Value box, type true.
-
Click Apply.
-
Restart the Library Server.
Enable the Preview Feature using the Properties file
-
Locate
configOverride.propertiesat..\webapps\MicroStrategyLibrary\WEB-INF\classes\config\configOverride.properties. -
Back up the file.
-
Open the file in a text editor.
-
Add the following line:
features.enableCrossProjectDataset=true -
Save the file.
-
Restart Tomcat for Strategy Library.
Add Data From a Specific Project
- Create a new dashboard or edit an existing one.
- In the toolbar, click the Add Data icon
 and select Existing Objects.
- From the top drop-down list, select the project that the objects are saved in.
- Navigate to and select the objects to add to the dataset.
You can connect live to the dataset or in-memory by changing the Data Access Mode.
Add a Filter
Optionally, create a filter to retrieve only the data that you need. Local project datasets come from the same project as the dashboard; remote project datasets (available if the cross-project preview feature is enabled) come from other projects.
For an in-memory local project dataset, the filter can include any object in the local project; you do not need to include the object on the dataset report.
You cannot add a filter to a live-connected dataset from the same project as the dashboard.
For remote project datasets, the filter can include any object in that dataset.
Filters cannot be circular; datasets cannot filter each other.
- To add a filter:
- Click Add Filter
 .
- The New Qualification window lists the objects that you selected for the report display in the Based on drop-down list. Do one of the following:
- Select one of the report objects.
- To select an object not in the dataset, click Browse Metadata Objects. Navigate to and select the object to filter on. This option is available for an in-memory local project dataset.
- If you selected an attribute, the filter is created as a list of elements (attribute values). You can select the elements or create a qualification.
For steps to create an attribute qualification, click here.
- From the Choose Elements By drop-down list, select Qualification On.
- Choose the attribute form, such as ID or DESC.
- Select the Operator, such as Equals or Greater than.
Do one of the following:
Enter a specific value to compare the attribute element to in the Value box.
To compare the attribute to another attribute in the dataset report or in the dashboard, select that attribute from the Attribute drop-down list. Choose the attribute form, such as ID or DESC.
If you select the In or Not In operator, you can compare it to an attribute from any in-memory dataset report used in the dashboard. In the first drop-down list below Attribute, select the dataset. Select the attribute from the second drop-down list. Choose the attribute form, such as ID or DESC.
- If you selected a metric, the filter is a qualification.
For steps to create the metric qualification, click here.
- From the drop-down list below Operator, select whether to filter the metric By Value or By Rank.
- Select the comparison operator, such as Equals or Greater than.
Do one of the following:
Enter a specific value to compare the metric to in the Value box. For by rank comparisons, this is the only option.
To compare the metric to another metric in the dataset report, select that metric from the Metric drop-down list.
To compare the metric to another metric not in the dataset report, click Browse. Navigate to and select the metric.
- Click OK.
- You can add another filter condition by clicking Add New Qualification and repeating the steps above.
- When the filter is complete, click Save. Now that you have created a filter on this dataset report, the filter icon, at the top right of the Add Existing Objects window, has a green dot. The link has also changed to Edit Filter.
- Click Add Filter
- Click Add.
- The new dataset displays in the Datasets panel. Hover your cursor over any dataset there to see the project name.
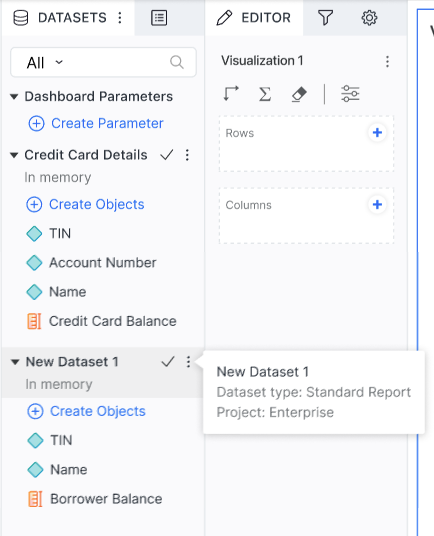
-
Link the attributes that are shared in common across multiple datasets. Linking allows you to:
-
Display data from multiple datasets in the same visualization.
-
Use a visualization based on one dataset as a filter to update the data displayed in a visualization based on another dataset.
-
Group data from one dataset based on an attribute that exists in another dataset.
-
-
Select Which Datasets Determine the Dashboard's Available Values.
-
Save the dashboard.